In the Loop – February 20, 2026
“In The Loop” is designed to give you a short update reflecting major developments, earnings, and investment trends across some core Equity Income and Growth holdings. All clients should be aware that individual buy/sell recommendations will be conveyed directly to you on an individual basis. Have a great weekend.
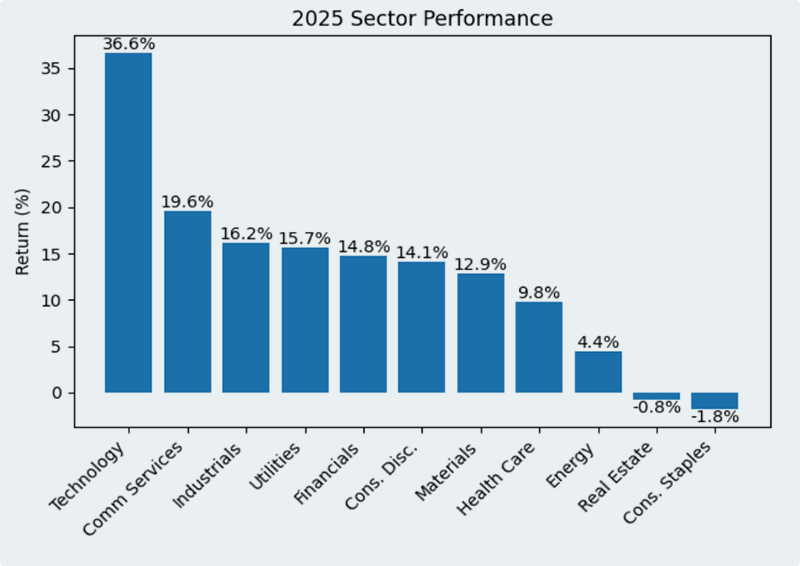
Recent performance provides important insight into where we are in the market cycle and how leadership is evolving. In 2025, market returns were led overwhelmingly by Information Technology and Communication Services, reflecting continued investor enthusiasm around artificial intelligence, cloud infrastructure, and digital platforms. Technology alone gained more than 36% for the year, far outpacing most other sectors. Industrials, Utilities, and Financials also posted solid gains, while traditionally defensive areas such as Consumer Staples and Real Estate lagged. This pattern is typical of a late-cycle, innovation-driven market environment where growth leadership dominates and capital concentrates in a narrow group of large, high-profile companies.
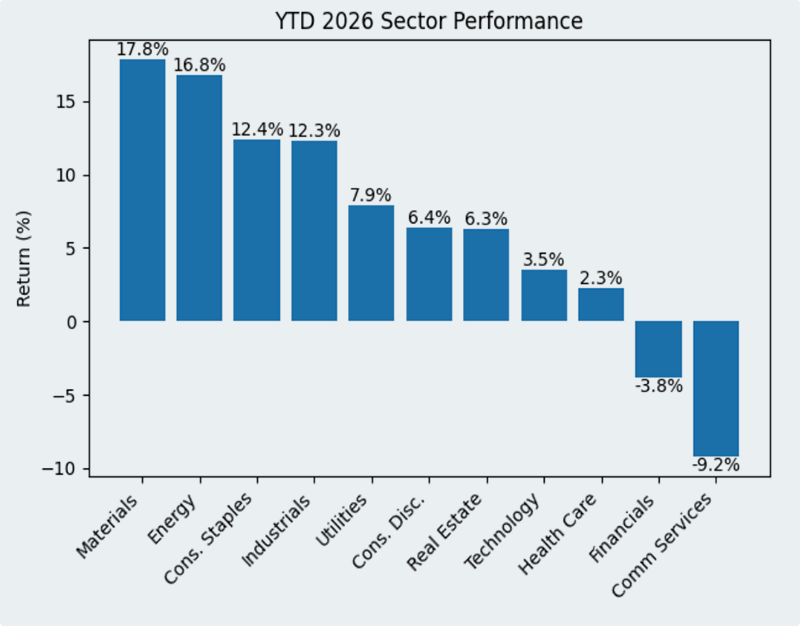
So far in 2026, however, leadership has begun to broaden and rotate. Year-to-date performance shows Materials and Energy at the top of the rankings, followed closely by Industrials and Consumer Staples. This shift reflects improving activity in manufacturing, infrastructure, and commodity-linked industries, alongside stabilizing inflation and renewed capital investment. At the same time, Technology and Communication Services have moved toward the middle or lower end of performance rankings, while Financials have struggled. This type of rotation is often seen as markets transition from a narrow, momentum-driven phase toward a more balanced, economically grounded expansion.
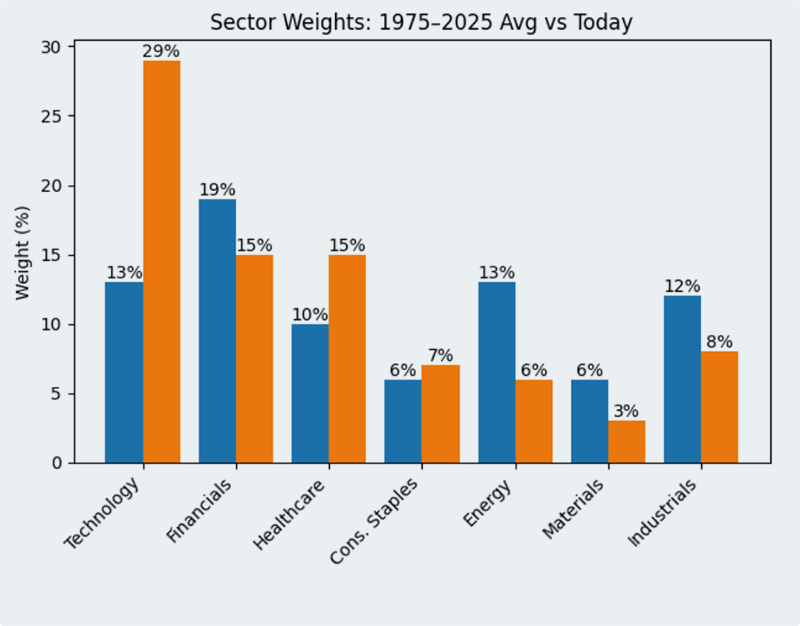
Looking beyond short-term performance, long-term sector weights provide critical perspective. Over the past 50 years, Technology has grown from roughly 13% of the S&P 500 to nearly 29% today, reflecting the central role of software, data, and digital infrastructure in the modern economy. Healthcare has also increased steadily as demographics and medical innovation drive long-term demand. In contrast, Energy, Financials, Industrials, and Materials now represent much smaller portions of the index than they did historically. Energy, in particular, has fallen from about 13% of the market to near 6%, highlighting years of underinvestment and structural underweighting. It is wild to think that the entire world runs on oil, yet it only represents 6% of the S&P500.
Taken together, these three trends tell a consistent story. Structurally, the U.S. market remains dominated by technology and knowledge-based industries. Cyclically, however, leadership is shifting toward real-economy sectors tied to manufacturing, power, materials, and infrastructure. This reflects a broader transition from liquidity-driven returns to earnings- and cash-flow-driven returns. In other words, markets are increasingly rewarding companies that generate durable profits, control costs, and support domestic investment.
For portfolios, this environment favors diversification across both structural leaders and cyclical beneficiaries. Technology and Healthcare remain essential long-term holdings, given their innovation capacity and economic importance. At the same time, renewed strength in Energy, Materials, and Industrials highlights the opportunity in sectors supporting U.S. production, supply chains, and energy security. These trends align closely with our U.S. Resiliency framework, which emphasizes domestic investment, infrastructure, advanced manufacturing, and reliable cash flows.
Our approach continues to focus on balancing long-term growth with real-economy stability. By combining exposure to innovative leaders with companies positioned to benefit from economic normalization and capital spending, we seek to participate in market upside while managing risk across cycles. As sector leadership evolves, we remain disciplined in adjusting allocations to reflect both structural change and cyclical opportunity.
This information was shared to us by our friends at Academy Securities: “The U.S. is sending the USS Ford Carrier Strike Group as well as dozens of jet fighters and support aircraft to the Middle East and is assembling the greatest amount of air power in the region since the 2003 invasion of Iraq. While a diplomatic solution is the goal, it appears increasingly unlikely as the two sides are too far apart, but as General Deptula from our team said recently, “Frankly, the best that could come out of this is that the dramatic increase in deployed forces will be significant enough of an indicator that Trump is not messing around with the use of force, thus prompting Iran’s leaders to come to an agreement.”
If “maximum leverage” does not work and negotiations fail, I would expect this to put a lot of pressure on oil prices. Let’s pray for PEACE. Just as a sidenote for no real purpose, The State of The Union is February 24, 2026.
Have a great weekend.
Individual Company Updates
Exxon Mobil delivered strong Q4 and full-year 2025 results, reporting $6.5 billion in fourth-quarter earnings (~$1.53/sh) and robust operating and free cash flow across the period. The energy giant generated $12.7 billion in operating cash flow and roughly $5.6 billion in free cash flow, enabling significant shareholder returns with $9.5 billion in distributions through dividends and buybacks, while underpinning continued investment in advantaged oil, gas, and low-carbon growth opportunities. XOM’s integrated portfolio remains a key beneficiary of resilient downstream markets and sustained premium pricing from advantaged production.
Chevron reported Q4 2025 earnings of ~$1.5 per share, slightly above expectations, while revenue nearly held up in a softer commodity price environment, reflecting disciplined capital deployment and robust downstream and midstream performance. Despite lower upstream profitability than in 2024, Chevron generated strong operating cash flow and continued to execute on production growth initiatives in major basins like the Permian and Gulf of America. The quarter highlighted CVX’s resilience through diversified operations and strong balance sheet discipline, even as broader oil price headwinds persisted.
EOG Resources is positioned to report Q4 2025 results later this month, with analysts expecting earnings near ~$2.20 per share and revenue above $5.3 billion. The company continues to benefit from strong free cash flow generation trends, and some analysts have maintained Buy ratings with price targets around ~$150, highlighting EOG’s attractive dividend yield and capital return profile. EOG’s disciplined investment and low-decline asset base are viewed as key strengths in a cycle marked by modest exploration activity and capped capex.
RTX capped 2025 with another beat on both top and bottom lines, reporting Q4 adjusted sales of ~$24.2 billion, up ~12% year-over-year and above consensus, while adjusted EPS of $1.55 also outpaced expectations. For the full year, RTX delivered $88.6 billion in sales (up ~10%) and adjusted EPS of ~$6.29, reflecting broad strength across commercial aerospace and defense segments. The company generated strong free cash flow (~$7.9 billion) and finished the year with a robust ~$268 billion backlog — underscoring sustained demand underlying both defense programs and commercial OE and aftermarket activity. Looking into 2026, RTX guided to continued growth with sales expected near $92–93 billion, modest organic growth, higher EPS, and solid cash flow conversion, supporting ongoing investment in technology and capacity expansion.
General Dynamics delivered another strong quarter to close out 2025, reporting Q4 EPS of $4.17 on ~$14.4 billion in revenue, both beating consensus estimates and extending a multi-quarter trend of operational outperformance. The year finished with significant backlog growth — a record $118 billion, up ~30% year-over-year — giving multi-year revenue visibility and reinforcing the company’s capital allocation flexibility. GD continues to balance disciplined investment with shareholder returns, increasing the quarterly dividend and maintaining a healthy payout ratio in the low-40s, supported by ~94% free cash flow conversion. Management expects stable revenue gains and expanding margins in 2026 backed by strong defense and aerospace demand, further enhancing its role as a core defense sector exposure.
Caterpillar reported a very strong Q4 2025, with record quarterly sales of about $19.1 billion (up ~18% YOY) and full-year sales exceeding $67 billion, the highest in company history. While margins were somewhat compressed due to higher manufacturing costs and tariffs, the company’s broad end-market strength — particularly in Power & Energy and Construction segments — drove volume growth and a record backlog, providing healthy demand visibility. Caterpillar also deployed significant cash toward dividends and repurchases while maintaining robust operating cash flow.
Eaton posted mixed Q4 2025 results, with revenue of roughly $7.05 billion and earnings per share ~ $3.33, roughly in line with expectations. The diversified industrial demonstrated continued demand in electrical, aerospace, and hydraulics markets, though growth varied by segment and near-term topline was somewhat pressured relative to expectations. Eaton’s strong free cash flow and balance sheet continue to support dividends and targeted buybacks, while investments in smart power management and electrification technologies remain a focus for medium- and long-term growth.
NVT delivered a strong fourth quarter and full-year 2025 performance, underscoring its successful pivot toward high-growth infrastructure end markets like AI data centers and electrical protection solutions. In Q4, revenue surged over 40% year-over-year to about $1.07 billion, with organic growth near 24% and non-GAAP EPS of roughly $0.90, slightly above expectations, reflecting robust demand for power, cooling, and connection products. For the full year, net sales climbed about 30% to $3.9 billion, with adjusted EPS up roughly 35% and free cash flow up roughly 31%, driven by strong operating leverage. Notably, NVT ended 2025 with a **$2.3 billion backlog — roughly triple year-ago levels — providing multi-year revenue visibility as major infrastructure projects convert to orders. Management also provided 2026 guidance targeting 15%–18% sales growth and 20%–24% EPS growth, supported by expanding infrastructure and data-center demand, while continuing to return capital through a rising dividend and disciplined buybacks.
Formidable Asset Management (“Massey Romans Capital”) is an investment adviser registered under the Investment Advisers Act of 1940. The information presented in the material is general in nature and is not designed to address your investment objectives, financial situation or particular needs. Prior to making any investment decision, you should assess, or seek advice from a professional regarding whether any particular transaction is relevant or appropriate to your individual circumstances. Although taken from reliable sources, the Firm cannot guarantee the accuracy of the information received from third parties.
The opinions expressed herein are those of the Firm and may not actually come to pass.Author
Paul MasseyRelated posts
In the Loop – October 24, 2025
It is hard to imagine that with the S&P500 close to all-time highs that we are j
In the Loop – June 12, 2026
Investors are understandably excited about the potential public offerings of sev
In the Loop – April 18, 2025
Markets are facing growing uncertainty as trade tensions, tariff concerns, and c