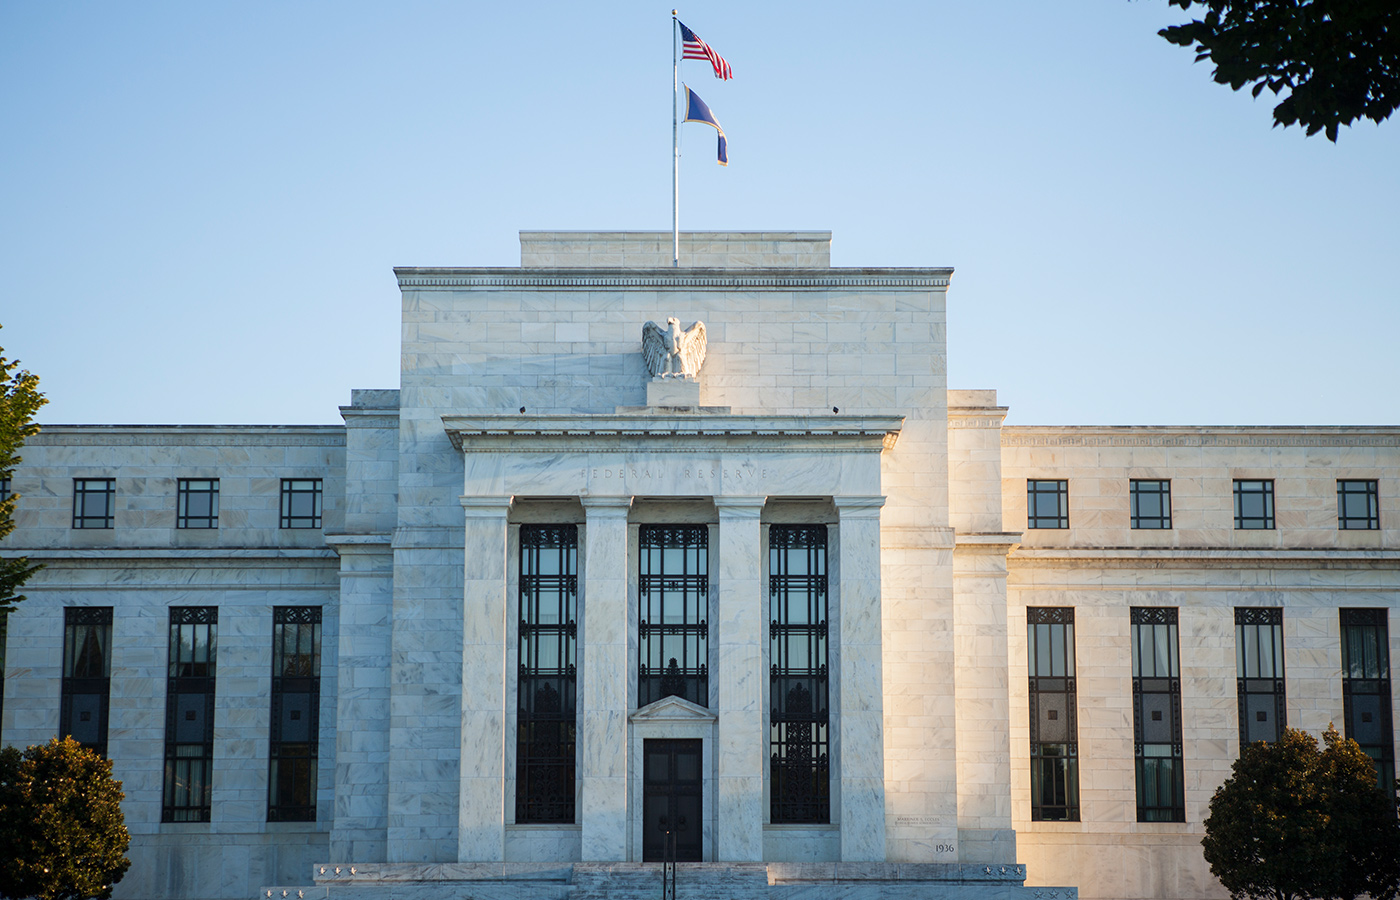
Federal Reserve Policy Shift
The Federal Reserve on 10/29/2025 signaled a Policy Change to the market that it will stop QT in December 2025 and resume QE in the first quarter of 2026 at an estimated amount of $35 Billion a month. We looked back into history and analyzed past markets to see if a pattern emerged under this scenario. First let’s explain Quantitative Easing (QE) and Quantitative Tightening (QT).
Quantitative Easing (QE) and Quantitative Tightening (QT) are tools the Federal Reserve uses to manage economic growth and inflation. QE is applied during recessions or financial stress when rate cuts alone aren’t enough. The Fed creates money to buy Treasury and mortgage-backed securities, injecting liquidity, lowering long-term interest rates, and encouraging borrowing and spending. QT is the reverse—used to slow an overheating economy or reduce inflation. The Fed sells bonds or lets them mature without replacement, pulling money out of the system, raising interest rates, and cooling economic activity. In short, QE fuels growth, while QT applies the brakes.
- The Fed began QE in late 2008 during the financial crisis, purchasing Treasury and mortgage-backed securities.
- The 10-year Treasury yield fell from ~4% in mid-2008 to around 2.3% by early 2009, as investors anticipated large-scale Fed buying and sought safety.
- Yields remained historically low through 2010 as QE purchases continued.
- When QE2 was announced in November 2010, yields briefly rose (from 2.4% to ~3.6%) due to improving growth expectations — but by mid-2011, as the program matured, yields fell back near 2% during renewed economic concerns.
- Key takeaway: the initial market reaction can be mixed, but sustained QE buying tends to pull yields down.
- Announced in late 2012, the Fed pledged indefinite monthly bond purchases.
- The 10-year yield fell from ~2% to 1.6% before rising again in 2013 during the “taper tantrum,” when investors feared an early end to QE.
- Overall, QE3 kept long-term yields structurally lower than they would have been without Fed support.
- When the Fed ended QT in mid-2019 and later cut rates, the 10-year yield dropped sharply from 2.7% in January to 1.5% by August, signaling investor confidence that liquidity would return and growth might weaken.
- At the onset of COVID-19, the Fed restarted QE on a massive scale. The 10-year yield collapsed from 1.9% to 0.5% in a matter of weeks — the lowest in modern history.
- End of QT → typically coincides with falling yields, as investors expect easier financial conditions and weaker growth.
- Start of QE → reinforces that trend, with 10-year yields historically dropping between 50–150 basis points within 3–6 months, depending on inflation expectations and the size of Fed purchases.
- The main exception occurs when QE is launched amid strong growth — in that case, yields can rise temporarily due to improved risk appetite before settling lower.
Backdrop: Severe recession, Fed cuts to zero, massive QE launch.
3–12 Month Performance After QE Start (Mar 2009–Mar 2010):
- Top Performing Sectors:
- Technology (+70%) – recovery in semiconductors and software as risk appetite returned.
- Consumer Discretionary (+80%) – sharp rebound from deep recession lows.
- Financials (+100%) – benefited from lower yields, liquidity injection, and steep yield curve.
- Lagging Sectors: Utilities, Staples, and Energy (due to weak demand).
- S&P 500: +65% in 12 months from QE1 start (the “great reflation rally”).
- Top Performing Sectors:
- Health Care (+35%) – strong earnings visibility, lower-rate tailwinds.
- Consumer Discretionary (+40%) – housing and auto recoveries.
- Tech (+25%) – low rates favored growth and multiple expansion.
- Lagging Sectors: Utilities (+8%), Energy (+10%).
- S&P 500: +20% over 12 months.
- Top Performing Sectors:
- Tech (+40%) – cloud, AI, and digital adoption boom.
- Communication Services (+25%) – digital media and internet platforms.
- Health Care (+20%) – defensive stability plus innovation.
- Lagging Sectors: Energy (-30%), Financials (+2%) due to yield compression.
- S&P 500: +12% from QT end to pre-COVID, then +40% within 1 year post-QE restart.
The S&P 500 is an unmanaged portfolio of specific securities, the performance of which is often used as a benchmark in judging the relative performance of certain asset classes. Investors cannot invest directly in an index. An index does not charge management fees or brokerage expenses, and no such fees or expenses were deducted from the performance shown.
Formidable Asset Management (“Massey Romans Capital”) is an investment adviser registered under the Investment Advisers Act of 1940. The information presented in the material is general in nature and is not designed to address your investment objectives, financial situation or particular needs. Prior to making any investment decision, you should assess, or seek advice from a professional regarding whether any particular transaction is relevant or appropriate to your individual circumstances. Although taken from reliable sources, the Firm cannot guarantee the accuracy of the information received from third parties.
The opinions expressed herein are those of the Firm and may not actually come to pass.Author
Paul MasseyRelated posts
Why Do Investors Care So Much About the Federal Reserve?
The Federal Reserve (Fed) is essential because they manage the supply or availab

Headwinds and Tailwinds
The seasonality of the markets has not disappointed us so far as investors in 20

Forecasting the 2023 Market Outlook
While the Federal Reserve might have our backs in the case of an economic or fin